Operate your connected sites with confidence.
A practical guide to monitoring tanks, devices, power sources, alerts, costs, and the operational history behind every decision.
See the shape of the workspace.
This public-safe preview is taken from the authenticated portal and sanitized before publication. Customer names, branches, account details, and live measurements are removed.
Sanitized capture · dashboard overview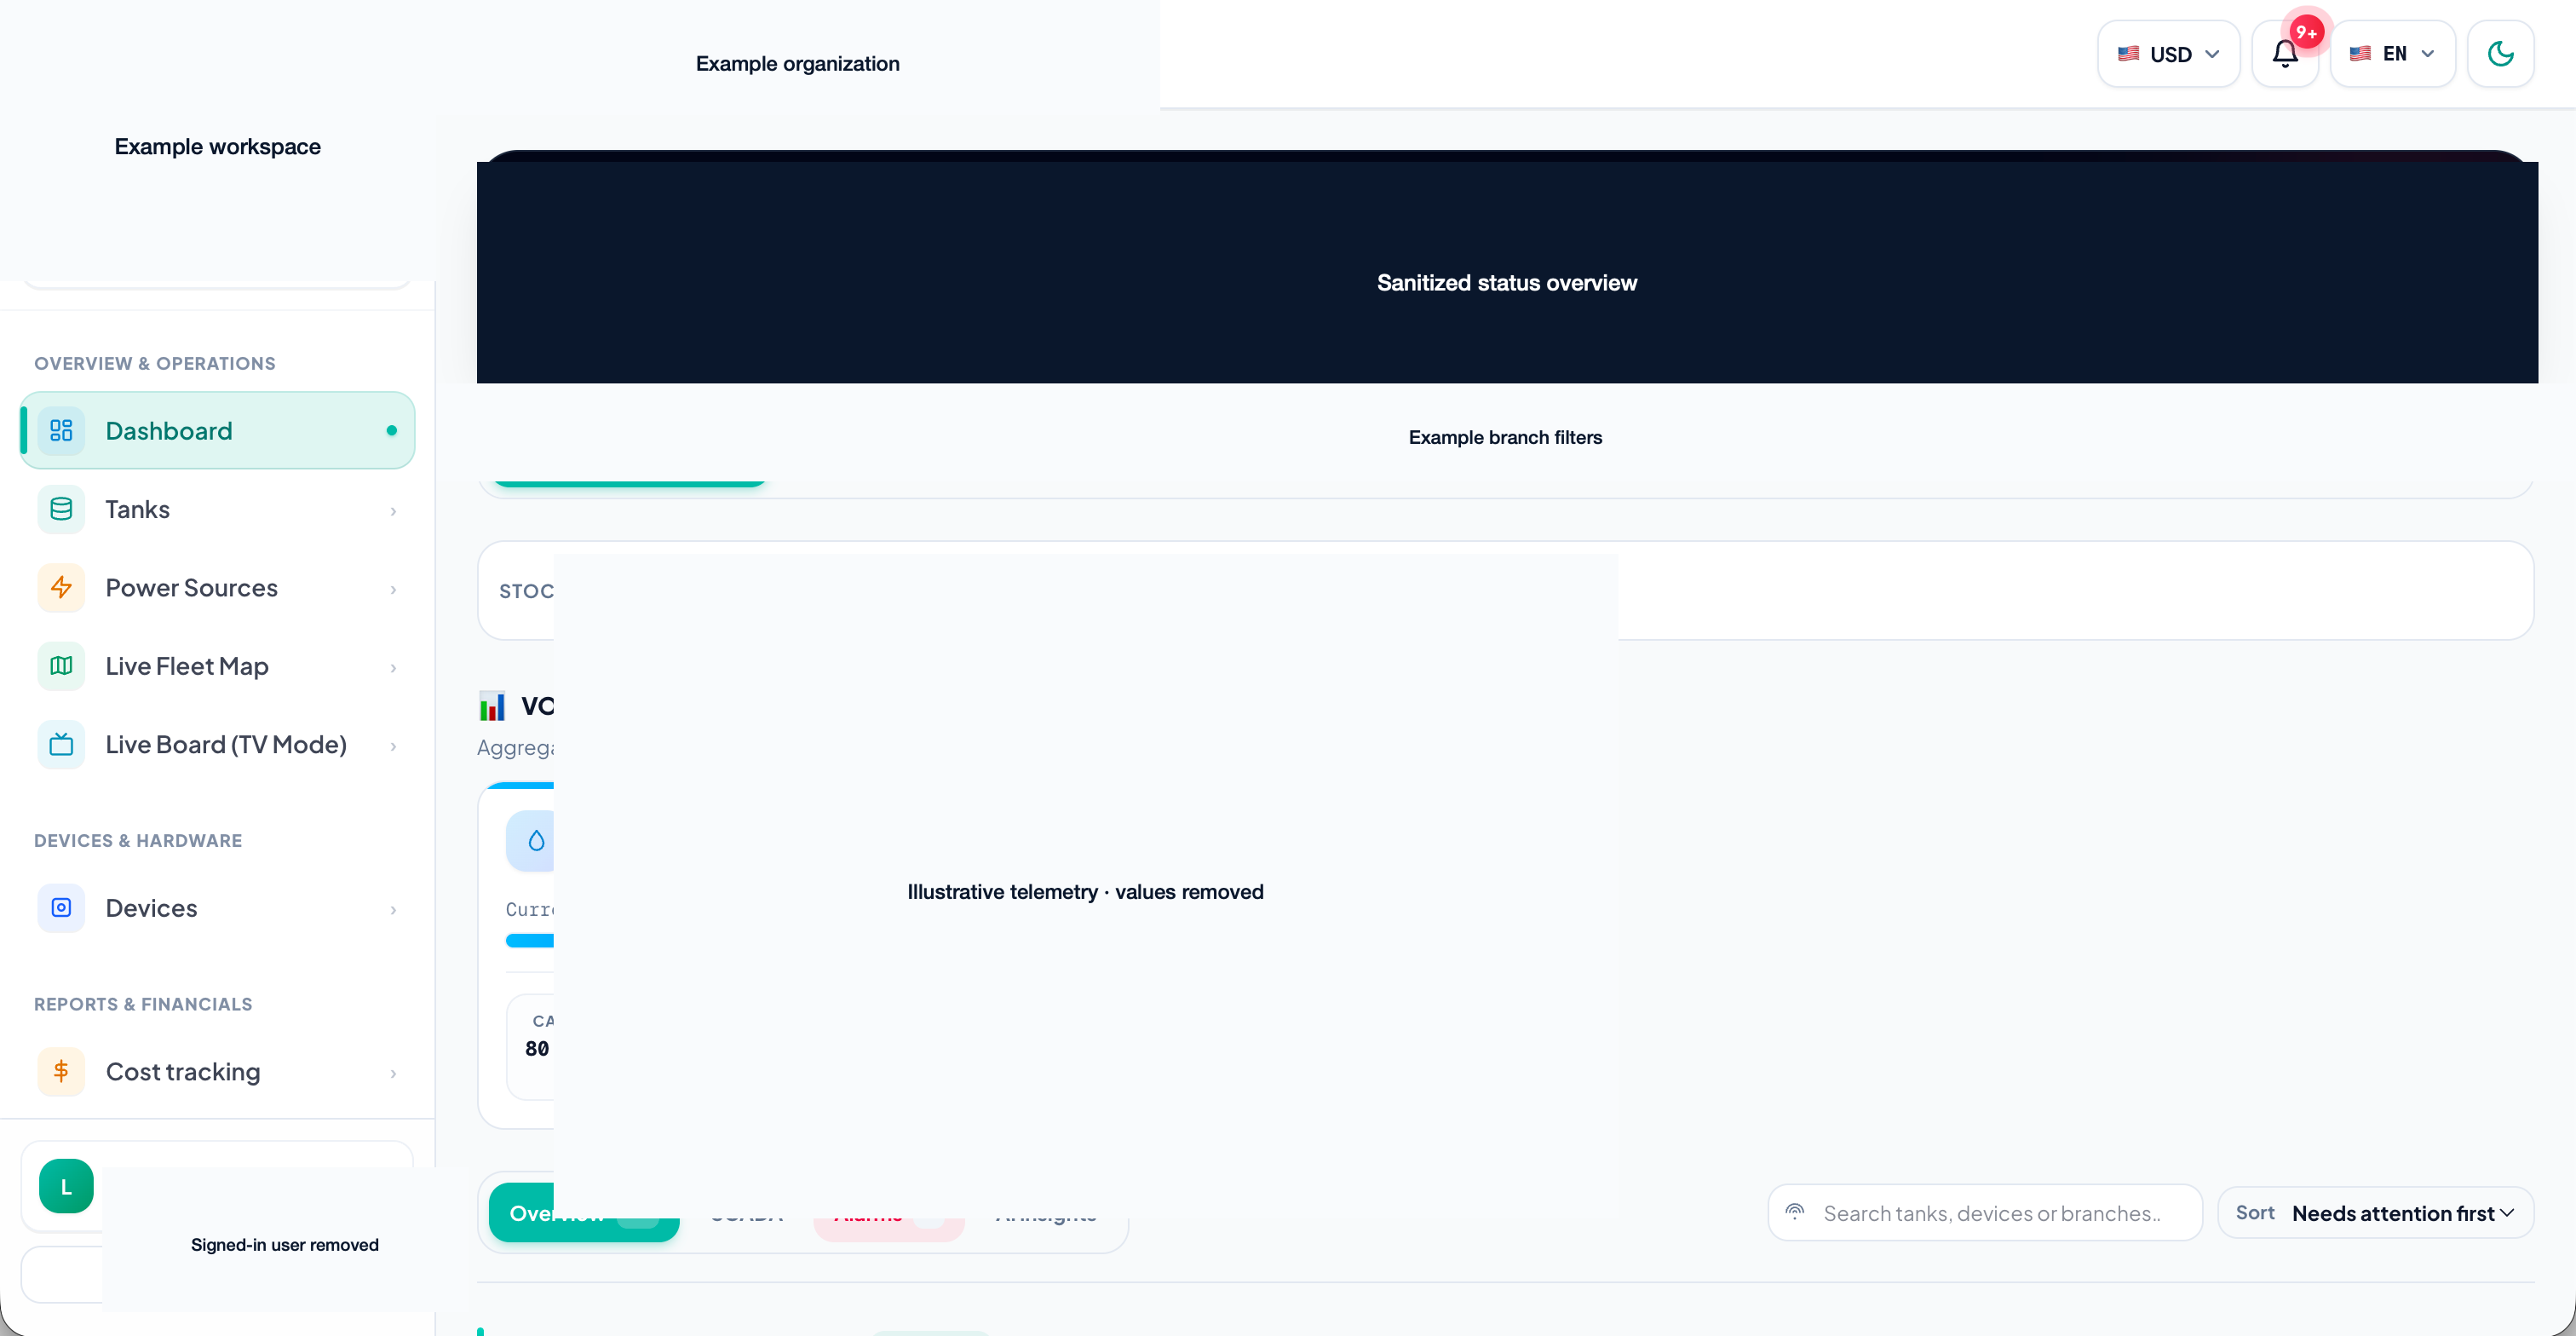
Get oriented quickly
Start with the essentials, then move into the workflows your team uses every day.
Sign in and find your way around
Understand authentication, the main navigation, organizations, branches, and the dashboard layout.
Read the guideSet up your organization
Learn how branches, team members, invitations, roles, and permissions fit together.
View topic mapRead the dashboard
Learn what the status indicators, gauges, activity panels, and live updates mean.
View topic mapMonitor what matters
Keep a clear view of devices, tanks, readings, and the events that change your operation.
Turn events into action
Follow the operational workflows that help teams record, review, and respond.
See the signal before it becomes a problem.
Alerts, notifications, status indicators, and the intelligence activity log give your team a shared operational picture.
Explore monitoringKnow what each status means.
Configure your attention around the events that matter.
Use activity history and forecasts as decision support.
Make decisions with history
Use costs and reports to connect operations to the information your organization needs.
Every answer should lead to a next step.
This manual will include practical troubleshooting, expected results, common mistakes, and escalation guidance for each verified workflow.
Review support stepsConfirm the correct organization, branch, tank, or device.
Use the relevant history, alert, or activity record.
Share the time, asset, and visible status with support.